Stochastics
Overview
George Lane observed that for a specified period, as prices increase, closing prices have a tendency to be ever nearer to the highs of the period. Similarly, as prices move lower, closing prices tend to be closer and closer to the lows for the period. In the late 1950s, he developed a price velocity technique to determine the relationship between the closing price of a security and its price range over a defined period of time (e.g. 5 days). This technique is known as Stochastics.
Stochastics is a momentum indicator and its value oscillates between 0 and 100. In an up market, Stochastics value increases towards 100 and conversely goes down in a down market. With the definition of upper and lower levels, overbought and oversold signals are generated when the indicator extends beyond these levels.
How it is calculated
Stochastics consists of 2 parameters which are %K and %D. The value of %K is ranging from 0 to 100 depends on how high is the recent closing price with respect to the highest and lowest price attained during the specified period. %D is obtained by taking a moving average of %K. The formulas for the two parameters are shown below:

The recommended N is from 5 to 21 periods (Meyers 1994).
The %K and %D discussed so far are specifically referred to as fast Stochastics as the two parameters labeled %K fast and %D fast respond very rapidly to market changes. This may generate several misleading signals. A smoother version is obtained by taking a 3-period moving average of both the %K fast and %D fast. The new parameters obtained are known as slow Stochastics.
How to interpret
Extreme Readings
It is not unusual for stochastics to reach 0% or 100%. These readings do not mean that the price of a particular stock has reached a bottom (0%) or top (100%). However, it does suggest great weakness (0%) or strength (100%).
When a reading of 0% is reached, stochastics frequently moves up to the 20-25% level and then declines again to or near the 0% level. When stochastics moves up from that area, a minor rally in prices may occur. The opposite holds for 100% readings (Meyers 1994).
Bearish/Bullish Stochastic Crossover
Bearish stochastic crossover is when %D fast moves below %D slow. In contrast, bullish stochastic crossover is when %D fast moves above %D slow. Bearish/bullish stochastic crossovers act as confirmations to bearish/bullish divergence.
Divergence Analysis
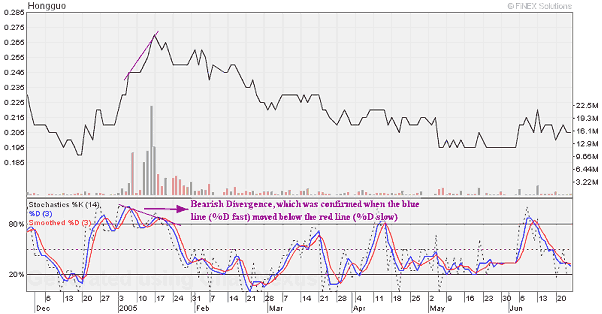
A bearish divergence occurs when price makes a high, then corrects moving lower, and subsequently, reaches a higher high. At the same time, corresponding peaks of the %D lines (%D fast and %D slow) make a high followed by a lower high. Confirmation and signal to sell occurs when there is a bearish stochastic crossover. See example below:

When price made a higher high on 17 January 2005, Hongguo's stochastics made a lower high, thus indicating bearish divergence. The divergence was confirmed soon afterwards when %D fast moved below %D slow. Following which, Hongguo's prices were trending down.
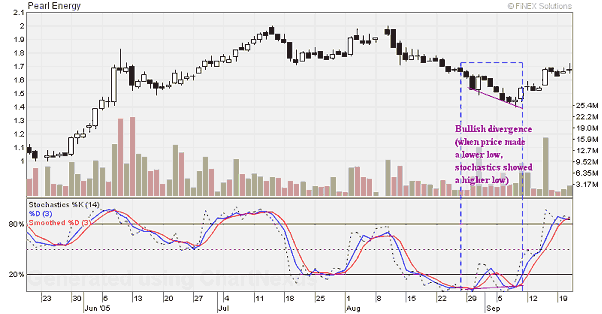
A bullish divergence occurs when price makes a low, then corrects moving higher, and subsequently, reaches a lower low. At the same time, corresponding peaks of the %D lines (%D fast and %D slow) make a low followed by a higher low. Confirmation and signal to sell occurs when there is a bullish stochastic crossover. See example below:

Pearl Energy had been declining since it mad a double top formation in early August 2005. On 8 September 2005, when price made a lower low, stochastics made a higher low, thus indicating bullish divergence. The divergence was confirmed when %D fast moved above %D slow. Notice that prices were trending up soon afterwards.
Rules available in ChartNexus
Stochastics Crossover
- %D crosses over smoothed %D
- Smoothed %D crosses over %D
Parameters available:
- Lower Limit - lower limit of stochastics
- Upper Limit - uper limit of stochastics
- %K Period - the period of %K
- %D Period - the period of %D
- Smoothed %D Period - the period of smoothed %D period
- x - the minimum distance between the %D line and smoothed %D line
- t - the maximum number of days that x occurs
Stochastics Divergence With Price
- Stochastics is increasing with price still moving down
- Stochastics is decreasing with price still moving up
Parameters available:
- Max Divergence Days - the maximum number of days during which the divergence occurs
- Min Divergence Days - the minimum number of days during which the divergence occurs
- Min Overlap Length - the minimum number of overlapping days during which price and stochastics diverge
- Price Slope - the minimum slope of the moving average of the price
- Stochastics Slope - the minimum slope of the moving average of stochastics
- Price MA Period - the number of days used for the period of the moving average of the price
- Stochastics MA Period - the number of days used for the period of the moving average of the stochastics
- Stochastics On Right - if value is set to YES , only divergences with stochastics slope on the right side of price slope are triggered
Stochastics Convergence With Price
- Stochastics is increasing with price moving up
- Stochastics is decreasing with price moving down
Parameters available:
- Max Convergence Days - the maximum number of days during which the convergence occurs
- Min Convergence Days - the minimum number of days during which the convergence occurs
- Min Overlap Length - the minimum number of overlapping days during which price and stochastics converge
- Price Slope - the minimum slope of the moving average of the price
- Stochastics Slope - the minimum slope of the moving average of stochastics
- Price MA Period - the number of days used for the period of the moving average of the price
- Stochastics MA Period - the number of days used for the period of the moving average of the stochastics
- Stochastics On Right - if value is set to YES , only convergences with stochastics slope on the right side of price slope are triggered
Buy signal
- Confirmation: price makes a high, then corrects moving lower, & subsequently reaches a higher high. At the same time, %D makes a high followed by a higher high.
- %K has been moving in one direction for many periods & suddenly reverses direction sharply (e.g. for 2-12%)
Sell signal
- Confirmation: price makes a low, then corrects moving higher, & subsequently reaches a lower low. At the same time, %D makes a low followed by a lower low.
- %K has been moving in one direction for many periods & suddenly reverses direction sharply (e.g. for 2-12%)
References :
- Meyers, T. A., The Technical Analysis Course: A Winning Program for Investors and Traders, 1994
