Rate Of Change (ROC)
Overview
It is a well-recognized phenomenon that prices surge ahead and retract in a cyclical, wavelike motion. This cyclical action is the result of the changing expectations as bulls and bears struggle to control prices.
Price Rate of Change (ROC) displays this wavelike motion in an oscillator format by measuring the difference between the current price and the price n-periods ago either in points or as a percentage (Achelis 1995) (Note: Compare this to Momentum indicator!)
ROC calculates the rate at which a security price changes over a given period of time (Pring 2002). As price increase, ROC rises; as price falls, ROC falls. The greater the change in prices, the greater the change in ROC.
How it is calculated
The following formula is used to display the price change in points:

If the price change is displayed in percentage, the following formula will be used:

Time Span
The most popular time periods are the 12- and 25-day ROC for short- to intermediate-term trading (Achelis 1995).
According to Pring (2002), for longer-term trends, a 12-month or 52-week time span is generally the most reliable, although a 24- or 18-month period can also prove useful. For intermediate trends, a 9-month, 26-week (6-month), or 13-week (3-month) time span works well. Price movements of even shorter duration are often reflected by a 10-, 20-, 25-, or 30-day time span. Reliable short/intermediate movements are often reflected with a 45-day (9-week) and 65-day (13-week) time span.
The analysis of any technical situation will be enhanced by the calculation of several ROCs, each based on a different time span (Pring 2002).
How to interpret
Overbought/Oversold
The higher the ROC, the more Overbought the security; the lower the ROC, the more Oversold the security. However, as with all Overbought/Oversold indicators, it is prudent to wait for the market to begin to correct (i.e. turn up or down) before placing your trade.
Divergence
A bullish divergence occurs when price makes a low, then corrects moving higher, and subsequently, reaches a lower low. At the same time, ROC makes a low followed by a higher low.
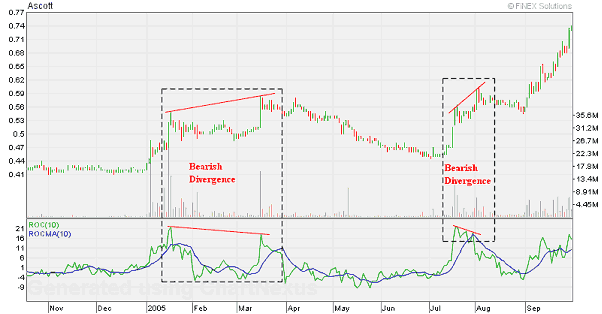
A bearish divergence occurs when price makes a high, then corrects moving lower, and subsequently, reaches a higher high. At the same time, ROC makes a high followed by a lower high.
Trend Reversal
Normally, a reversal in the momentum trend acts as confirming evidence of a price trend reverse signal. In effect, this momentum signal performs the act of supplementary "witness" in our weight of the evidence approach. The actual buy and sell signals can only come from a reversal in trend of the actual price, not the momentum series (Pring 2002).
Example
We purposely choose the same example for ROC and Momentum to show the similarity of the two indicators. Investors can choose to use either one.

In the above chart, Ascott displayed two bearish divergence: while prices were making a higher high, ROC formed a lower high. The first divergence led to declining prices for almost three months; whereas the second divergence resulted in short-term price weaknesses.
References :
- Achelis, S. B., Technical Analysis from A to Z, 1995
- Pring, M. J., Technical Analysis Explained, 2002
