Williams' %R
Overview
Developed by Larry Williams, Williams' %R is a momentum indicator that measures overbought/oversold levels (Achelis 1995).
How it is calculated
As Williams %R works much like the Stochastic oscillator, the formula used to calculate Williams' %R is similar to Stochastics oscillator, but not the same:
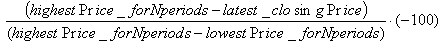
Compared to Stochastics, Williams' %R is plotted on an upside-down scale (the multiplier is -100 instead of 100). Another different is that Stochastics has internal smoothing, but Williams' %R does not have one. The chart below clearly depicts the similarities and differences between Williams' %R and Stochastic.
Typically, Williams' %R is calculated using 14 periods. However, the timeframe and number of periods may vary according to the desired sensitivity and the characteristics of the security.
How to interpret
Extreme Readings
As it is not unusual for stochastics to reach 0% or 100%, it is also not unusual for Williams' %R to reach -100 or 0. These readings do not mean that the price of a particular stock has reached a bottom or top. However, it does suggest great weakness (-100) or strength (0).
As with all Overbought/Oversold indicators, it is best to wait for the security's price to change direction before placing your trades. If Williams' %R is showing an Overbought condition, it is wise to wait for the security's price to turn down before selling the security. The MACD is a good indicator to monitor change in a security's price.
Example
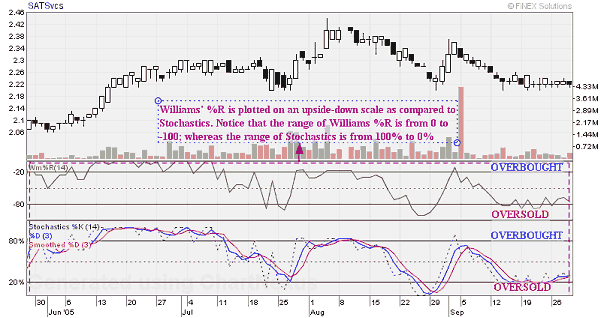
While Williams' %R stayed in the Overbought level from 13 June to 4 July 2005, SATSvc prices were generally remained uptrend. At the same time, MACD line remained above the signal line, suggesting bullish sentiments. Thus, selling simply because SATSvc appeared Overbought on mid of June 2005 would take investors out of the stock long before prices showed signs of deterioration.
Notice that after trending up, prices moved sideways. During this time, MACD line crossed below the signal line, suggesting bearish crossover. Following which, prices displayed short-term weaknesses and Williams' %R crossed down, reaching an Oversold level. Finally, prices picked up again, Williams' %R reached and stayed at the Overbought condition again and MACD made a bullish crossover. An important point to note here is that during this time, MACD stayed above the zero line, indicating underlying bullish sentiments.
References :
- Achelis, S. B., Technical Analysis from A to Z, 1995