Moving-Average Convergence Divergence (MACD)
Overview
Moving-Average Convergence Divergence (MACD) was developed by Gerald Appel in the 1960s. Since it is constructed from Moving Average (MA), it inherits the trend-following property of MA. Consequently MACD works best in trending markets and performs poorly during sideways trading.
MACD gets its name from the fact that the shorter MA is continually converging toward and diverging from the longer term-one.
Like MA, MACD is a trend-following indicator that simply tell you what the prices are doing (i.e. rising or falling) so that you can invest accordingly. Trend indicators have you buy and sell late and, in exchange for missing the early opportunities, they greatly reduce your risk by keeping you on the right side of the market (Achelis 1995).
How it is calculated
MACD is an oscillator constructed from the division of one MA by another. The two MAs are usually calculated on an exponential basis in which the more recent periods are more heavily weighted than in the case of a simple MA (Pring 1991).
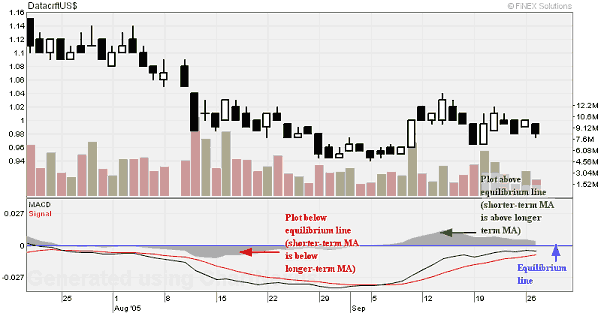
A typical combination used by Appel is the 26-period exponential MA with the 12-period exponential MA. The MACD line is calculated by subtracting the longer period moving average from the shorter period moving average. This creates a momentum oscillator whose values oscillate around the horizontal equilibrium line (zero-line) which represents the points at which the two MAs are having the same value.
Ironically the default time span used for daily charts (26/12 with a 9-day signal line) appears to work better on monthly ones because it manages to retain the primary trend swings yet the signal line whipsaw crossovers are kept to a minimum (Pring 2002).
When the indicator moves through this line, it means that the shorter-term MA is crossing the longer-term MA. Plots below the horizontal line indicate when the shorter-term MA is below the longer-term MA and vice versa.

How to interpret
Divergence Analysis
A bearish divergence occurs when price advances or moves sideways and MACD line declines. The negative divergence in MACD can take the form of either a lower high or a straight decline.
A bullish divergence occurs when price declines or moves sideways and MACD line moves up. The positive divergence in MACD can take the form of either a higher low or a straight incline.
Bearish/Bullish MA Crossover
A bearish MA crossover occurs when MACD line crosses below the signal line; whereas a bullish MA crossover occurs when MACD line crosses above the signal line.
Not only are these crossovers are the most common ones, but they also produce the most false signals. As such, they should be confirmed with other indicators to avoid whipsaws and false readings.
Bearish/Bullish Centerline Crossover
A bearish centerline crossover occurs when MACD moves below zero and into negative territory, creating a plot below the equilibrium line. This is a clear indication that momentum, at least for the short term, has changed from bullish to bearish.
A bullish centerline crossover occurs when MACD moves above zero and into positive territory, creating a plot above the equilibrium line. This is a clear indication that momentum, at least for the short term, has changed from bearish to bullish.
The centerline crossover can act as an independent signal, or confirm a prior signal such as divergence and MA crossover (Pring 1991).
Example

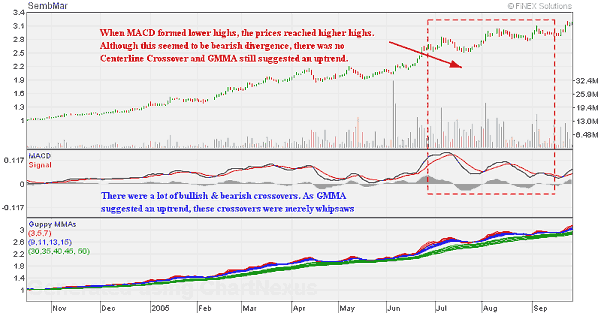
Looking at the MACD indicator of SembMar, there were a lot of bullish and bearish crossovers. To avoid whipsaws and false readings, they should be confirmed with other indicators. In this example, when we look at GMMA, it seemed to suggest an uptrend. Without confirmation, the crossovers were merely whipsaws.
On 6 July, 10 August and 5 September 2005, while prices were rallying higher highs, MACD line formed lower highs. To confirm that this was a bearish divergence, one should check for any centerline crossovers or check what the other indicators were telling. In this case, GMMA was still suggesting an uptrend. Indeed on 23 September 2005, SembMar climbed to another new high.
References :
- Achelis, S. B., Technical Analysis from A to Z, 1995
- Pring, M. J., Technical Analysis Explained, 2002
- Pring, M. J., Technical Analysis Explained: The Successful Investor's Guide to Spotting Investment Trends and Turning Points, 3rd Edition, 1991
